TL;DR
- Enterprise data analytics collects, processes, and analyses large-scale business data to drive operational and strategic decisions.
- It combines BI tools, data pipelines, and custom dashboards to give leaders a real-time view of performance.
- By reading this blog, you will understand the benefits, how to build an analytics strategy, and how to choose the right platform or partner.
Enterprise data analytics is the process of collecting, processing, and analysing large-scale business data to drive operational and strategic decisions across an organisation. It goes well beyond spreadsheets and basic reports. When implemented correctly, it becomes the operational nervous system through which every major business decision is informed.
According to McKinsey Global Institute research, data-driven organisations are 23 times more likely to acquire customers, 6 times more likely to retain them, and 19 times more likely to be profitable than their less data-mature peers.
This guide covers what enterprise data analytics involves, the business benefits it delivers, how to build an analytics strategy from scratch, and what to look for when choosing a platform or development partner.
What Is Enterprise Data Analytics?
Enterprise data analytics refers to the systematic use of data collected across the full breadth of a business to generate insights that inform decisions at the operational, tactical, and strategic level. It is not a single tool or department. It is an organisation-wide capability built on integrated data infrastructure, governance practices, and analytical processes.
Standard reporting tells you what happened last month. Basic BI dashboards visualise historical data in charts. Enterprise analytics goes further. It unifies data across sales, finance, operations, marketing, and supply chain into a single analytical environment where patterns, anomalies, and opportunities become visible across the whole business, not just within individual functions.
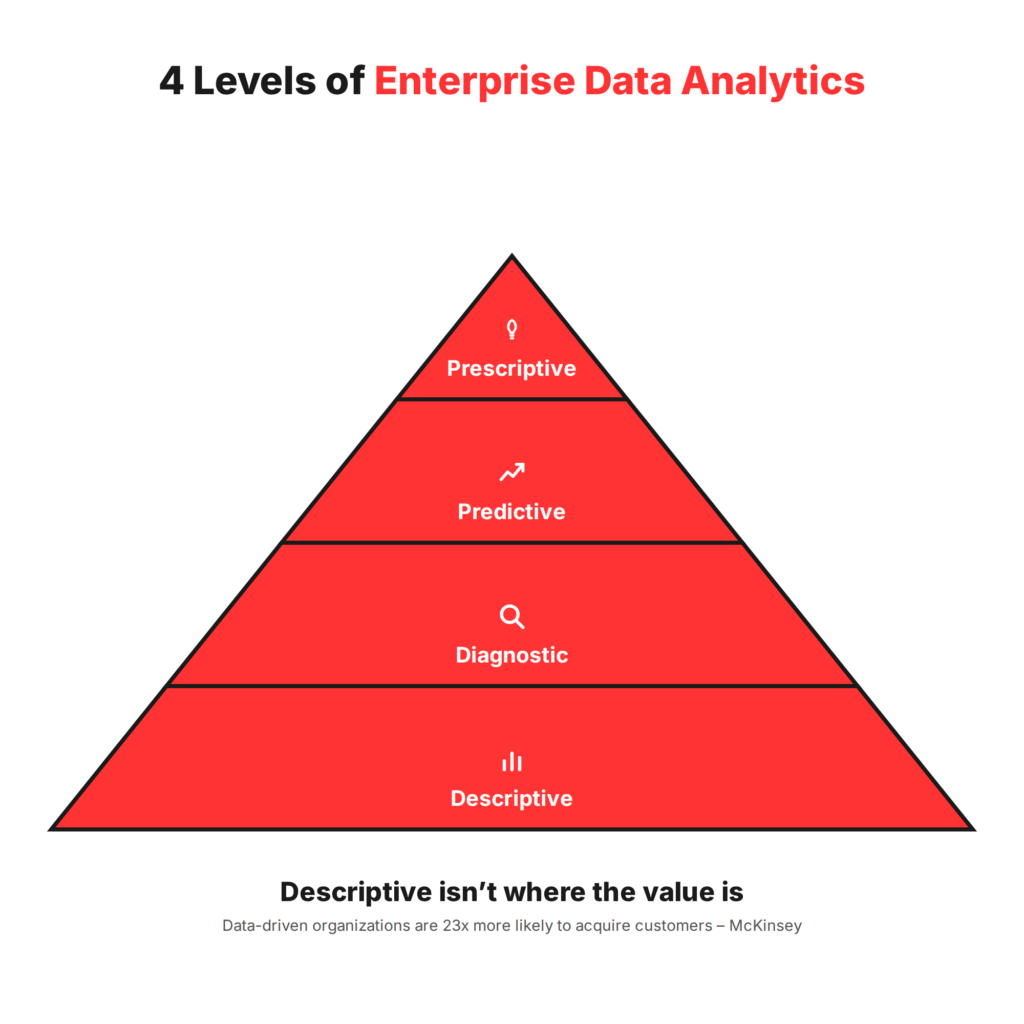
Descriptive, Diagnostic, Predictive, and Prescriptive Analytics
The four levels of enterprise analytics represent progressively more valuable forms of insight.
Descriptive analytics answers what happened. Revenue by region last quarter, customer churn rate year-on-year, and inventory levels by SKU are all descriptive. This is the foundation of most enterprise BI solutions and the starting point for every analytics programme.
Diagnostic analytics answers why it happened. Sales dropped in Q3 — was it a specific product, a region, a competitor launch, or a pricing change? Diagnostic analytics drills into the data to isolate causes rather than simply reporting symptoms.
Predictive analytics answers what is likely to happen. By applying statistical models and machine learning to historical patterns, predictive analytics forecasts demand, identifies customers at risk of churning, and models the likely impact of a pricing change before it is made. This is where an enterprise analytics strategy begins to create significant competitive advantage.
Prescriptive analytics answers what should we do. It combines predictive models with optimisation logic to recommend specific actions, such as which customer segment to target, which product to discount, or which supply chain route to prioritise. Generative AI development services are increasingly embedded in prescriptive analytics layers to surface natural language recommendations directly from complex data models.
What Are the Key Benefits of Enterprise Data Analytics?
Faster, More Confident Decision Making
Without analytics, senior leaders make decisions based on the most recent report they received, their accumulated experience, and instinct. All three are valuable. None of them scales with the complexity of a modern enterprise.
Data-driven decision making at the enterprise level replaces that uncertainty with evidence. A marketing team with a real-time customer analytics dashboard makes campaign budget decisions in hours, not weeks. An operations team with live production data identifies a bottleneck the same day it emerges rather than discovering it in the next monthly review.
Operational Efficiency and Cost Reduction
Data reveals waste that is invisible to human observation at scale. An enterprise with 50 warehouses, 200 product lines, and 5,000 daily orders cannot identify its inefficiencies through manual review. An analytics platform tracking throughput, error rates, and unit costs across all those dimensions simultaneously can surface patterns that save millions.
Big data analytics services applied to operational data consistently identify over-provisioned inventory, underutilised capacity, supplier performance issues, and process bottlenecks that would otherwise remain buried in operational noise for months. The ROI from operational analytics is typically the fastest to materialise and the easiest to quantify.
Revenue Growth Through Customer Intelligence
Customer analytics is where enterprise data analytics delivers its highest revenue impact. Unified customer data that combines purchase history, support interactions, browsing behaviour, and demographic attributes enables personalisation at a scale that generic campaigns cannot replicate.
Churn prediction models identify at-risk customers before they leave, enabling retention interventions that cost a fraction of re-acquisition. Upsell and cross-sell models surface the right offer to the right customer at the right moment. When this intelligence is embedded in the CRM and marketing automation platforms that sales and marketing teams already use, it drives measurable revenue improvement within the first quarter of deployment.
What Are the Core Components of an Enterprise Analytics Stack?
Data Ingestion and Pipelines
Raw data lives in dozens of disconnected systems: ERP, CRM, e-commerce platform, logistics software, financial systems, and customer support tools. Before any analysis can happen, this data must be extracted, transformed, and loaded into a unified environment.
Data pipelines are the infrastructure that makes this possible. They run on schedules or in real time, pulling data from source systems, applying transformation rules to standardise formats and clean errors, and loading the result into the analytics environment.
The quality of the pipeline determines the quality of everything downstream. Application modernization work that updates legacy source systems is frequently a parallel workstream when building enterprise data pipelines, as legacy systems often lack the APIs and export capabilities that modern data ingestion tools require.
Data Warehouse and Storage Layer
The data warehouse is the central repository where unified, cleaned, and structured data is stored for analytical querying. Cloud data warehouses including Snowflake, Google BigQuery, and Amazon Redshift have become the standard for most enterprise deployments because they separate compute from storage, enabling organisations to query massive datasets without provisioning dedicated infrastructure.
On-premise data warehouses are still appropriate in specific contexts: organisations with strict data sovereignty requirements, those with existing capital investments in on-premise infrastructure, and industries where regulatory constraints limit cloud hosting. Cloud and DevOps integrations that automate warehouse provisioning, scaling, and maintenance reduce the operational overhead of cloud data warehouse management significantly.
BI and Visualisation Layer
The BI and visualisation layer is what business users interact with directly. Dashboards, self-serve reporting tools, and automated alerts translate the data in the warehouse into the formats that operational managers, finance teams, and executives can act on.
The leading data analytics platforms for enterprise users in this layer include Tableau, Power BI, and Looker. Each has different strengths: Power BI integrates most naturally with Microsoft ecosystems, Tableau offers the most powerful custom visualisation capability, and Looker is strongest for organisations that want to embed analytics in their own products through its API layer.
Self-serve analytics capability, where business users can build their own queries and reports without engineering support, is the feature that determines adoption rates more than any technical specification.
How Do You Build an Enterprise Analytics Strategy?
Start with Business Questions, Not Data
The most common mistake in enterprise analytics programmes is starting with the data that exists rather than the decisions that need to be made. This produces dashboards that are technically accurate and practically unused.
An effective enterprise analytics strategy starts with a structured workshop that identifies the five to ten decisions the business makes most frequently where better data would produce better outcomes. Which customers are most at risk of churning this quarter? Which product lines are underperforming relative to their cost to serve? Where in the fulfilment process are delivery delays originating? Each question becomes an analytical use case with defined data requirements, success metrics, and a named business owner who will use the output.
Data Governance and Quality Standards
Bad data produces confident, wrong insights, which are more dangerous than no insights at all. Data governance is the framework of policies, processes, and accountabilities that ensures the data in the analytics environment is accurate, consistent, and trustworthy.
Governance covers data ownership, where each data domain has a named owner accountable for its accuracy. It covers data definitions, where shared metrics like “active customer” and “completed order” are defined consistently across all systems and teams. And it covers data quality monitoring, where automated checks flag anomalies in incoming data before they corrupt downstream reports.
Organisations that invest in governance before building dashboards produce analytics programmes that maintain trust over time. Those that do not spend enormous amounts of time defending their numbers rather than acting on them.
Build vs Buy: Platform or Custom Solution?
Off-the-shelf BI tools are the right choice for organisations whose analytical needs fit within standard reporting patterns. Power BI or Tableau connected to a cloud data warehouse can serve most enterprise reporting needs cost-effectively and quickly.
Custom analytics development is warranted when the organisation has analytical requirements that standard tools cannot serve: complex multi-source data models that require custom transformation logic, embedded analytics in a customer-facing product, real-time streaming analytics for operational decision making, or predictive models that need to be integrated directly into operational workflows.
Custom software development capability is the distinguishing factor between partners who can configure existing tools and those who can build the analytical infrastructure from the ground up. The build vs buy decision should be evaluated use case by use case rather than applied uniformly across the entire analytics programme.
How Does American Chase Build Enterprise Analytics Solutions?
Our Approach to Custom Analytics Development
American Chase approaches enterprise data analytics engagements with a structured discovery phase that identifies the specific business decisions the analytics programme is designed to support before any technical architecture is designed. This ensures that the resulting infrastructure is built around real use cases rather than generic data warehouse best practices that may not match the organisation’s actual analytical workflows.
The engagement covers data audit and source system mapping, data pipeline design and build, data warehouse provisioning and modelling, BI layer configuration or custom dashboard development, and governance framework design. For organisations whose source systems are too fragmented or outdated to support modern data ingestion, application modernization is often scoped as a parallel workstream to ensure the data foundation is sound before the analytics layer is built on top of it.
Post-delivery, American Chase provides ongoing support covering pipeline monitoring, data quality management, dashboard iteration based on user feedback, and the addition of new data sources and analytical use cases as the programme matures. Visit americanchase.com to discuss your enterprise analytics requirements.
FAQs About Enterprise Data Analytics
What is enterprise data analytics?
Enterprise data analytics is the systematic collection, processing, and analysis of large-scale business data to inform decisions across an organisation. It combines data pipelines, warehouses, BI tools, and predictive models into a unified capability that gives operational and strategic leaders evidence-based insight rather than relying on reports and instinct alone.
What is the difference between business intelligence and enterprise analytics?
Business intelligence focuses on historical reporting: what happened and when. Enterprise analytics extends into diagnostic, predictive, and prescriptive capability: why it happened, what is likely to happen next, and what actions to take. Enterprise analytics requires more sophisticated data infrastructure and modelling but delivers significantly higher decision-making value than BI reporting alone.
How do you build an enterprise analytics strategy from scratch?
Start by identifying the five to ten business decisions most frequently made where better data would produce better outcomes. Map the data required for each decision, assess its availability and quality, design the pipeline and storage architecture, and build the reporting layer around named use cases with defined business owners rather than building dashboards in search of an audience.
What tools are used in enterprise data analytics?
Common tools include Snowflake, BigQuery, and Redshift for data warehousing; dbt and Apache Airflow for pipeline orchestration; Tableau, Power BI, and Looker for BI and visualisation; and Python and SQL for analytical modelling.
What is the cost of implementing enterprise analytics?
A foundational enterprise analytics implementation covering data pipeline, cloud warehouse, and BI layer typically costs $80,000 to $250,000. More complex programmes with custom predictive modelling, embedded analytics, or real-time streaming capability range from $250,000 to $1 million or more.
Should we build a custom analytics platform or use an off-the-shelf tool?
Use off-the-shelf tools when standard reporting meets your analytical needs. Build custom when you need embedded analytics in a product, real-time operational analytics, complex multi-source data models, or predictive models integrated into operational workflows. Most organisations use a combination: standard BI tools for reporting and custom development for use cases that packaged tools cannot serve adequately.
What is predictive analytics in an enterprise context?
Predictive analytics applies statistical models and machine learning to historical data to forecast future outcomes. In an enterprise context, common applications include customer churn prediction, demand forecasting, supplier risk scoring, and equipment failure prediction.
How long does it take to implement enterprise data analytics?
A foundational implementation covering data pipeline, warehouse, and basic BI dashboards typically takes 8 to 16 weeks. A more complex programme with custom modelling, real-time streaming, and self-serve analytics capability takes 4 to 9 months.
What is data governance and why does it matter for analytics?
Data governance is the framework of policies, definitions, and accountabilities that ensures analytical data is accurate, consistent, and trustworthy. Without governance, different teams use different definitions for the same metric, data quality degrades silently, and analysts spend more time defending numbers than acting on them.
How do we ensure data quality in our analytics pipeline?
Data quality requires automated validation checks at every pipeline stage: schema validation when data is ingested, completeness checks for critical fields, range checks for numerical values, and referential integrity checks for relational data. Anomaly detection that flags unexpected changes in data volumes or distributions catches silent failures before they corrupt downstream reports.